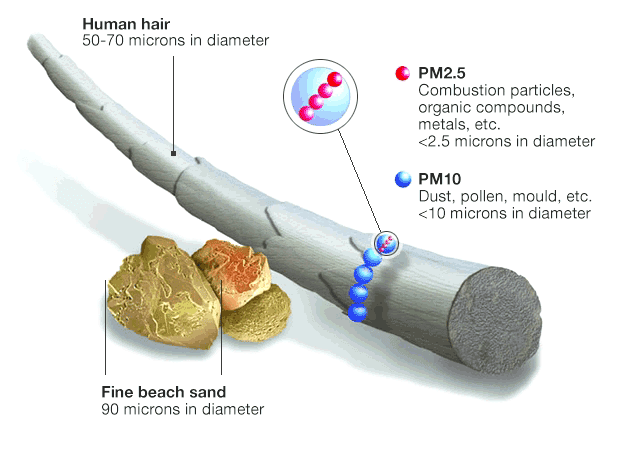
Particle pollution is a mixture of solid particles and liquid droplets. EPA Victoria monitors the air for two categories of particle size: PM2.5 and PM10. These particles are very small and are measured in micrometres (µm).
PM2.5 particles are smaller than 2.5 micrometres (0.0025 mm) in diameter. Often described as fine particles, they are up to 30 times smaller than the width of a human hair.
The PM2.5 data on the EPA Victoria website is reported as a mass per volume of air – micrograms per cubic metre (µg/m3). At some air monitoring stations we also measure particles in terms of visibility reduction.
Health effects of PM2.5 particles
PM2.5 particles are small enough to be breathed deep into the lungs. This can cause health effects. Children, people over 65, pregnant women and people with existing heart or lung conditions (including asthma) are more sensitive to the effects of breathing in fine particles. Symptoms may include wheezing, chest tightness and difficulty breathing.
For more information see Effects of smoke.
Sources of PM2.5 particles
PM2.5 particles result from the burning of fossil fuels (such as coal), organic matter (including wood and grass) and most other materials, such as rubber and plastic. Motor vehicles, power plant emissions and bushfires are all major sources of fine particles.
How EPA monitors PM2.5
EPA measures the levels of PM2.5 particles in the air using different types of air monitors. Most of EPA’s PM2.5 air monitors produce data that goes on their website. This includes data from some portable air monitors.
The portable mobile monitors allow EPA to monitor air quality at a greater variety of sites. Although they are less accurate than other types of PM2.5 monitors, they provide a good indication of local air quality and complement the data from other particle monitors.
One-hour average and 24-hour rolling average
A one-hour average is the average levels of PM2.5 particles over a one-hour period. The 24-hour rolling average is the average of the hourly readings of PM2.5 over the previous 24-hour period. It is updated each hour.
EPA displays one-hour averages on EPA AirWatch using air quality categories.
EPA displays 24-hour rolling averages on EPA AirWatch using two categories. The category depends on the type of air monitor used:
- Data collected by air monitors that meet Australian Standards is shown using health categories.
- Data collected by portable air monitors is shown using air quality categories.
For more information see What are one-hour and 24-hour averages?
PM2.5 health categories
EPA and the Department of Health and Human Services (DHHS) have developed a system of seven categories for smoky air (PDF 1.4MB) founded on international research. The categories are based on the concentrations of PM2.5 in the air. Each category has practical health advice that members of the community can follow in the event of smoky conditions.
Only 24-hour rolling average PM2.5 data collected from monitors that meet Australian Standards are displayed using these categories. This PM2.5 data is displayed on our website in different colours, depending on the concentration of PM2.5 in the air.
Cautionary health advice is automatically displayed on EPA AirWatch when the 24-hour rolling average reaches 26 µg/m3 or higher.
| Health category | 24-hour PM2.5 μg/m3 |
|---|---|
| Low | 0–8.9 |
| Moderate | 9.0–25.9 |
| Unhealthy – sensitive | 26.0–39.9 |
| Unhealthy – all | 40.0–106.9 |
| Very unhealthy – all | 107.0–177.9 |
| Hazardous (high) | Greater than 177.9 |
| Hazardous (extreme) | Greater than 250 |
For more information see Effects of smoke.
PM2.5 air quality categories
EPA displays all one-hour average PM2.5 data on EPA AirWatch using air quality categories. 24-hour rolling average data from portable PM2.5 air monitors is also displayed using these categories.
| Air quality category | 24-hr PM2.5 µg/m3 | One-hour PM2.5 µg/m3 |
|---|---|---|
| Very good | 0–8.2 | 0–13.1 |
| Good | 8.3–16.4 | 13.2–26.3 |
| Fair | 16.5–25.0 | 26.4–39.9 |
| Poor | 25.1–37.4 | 40–59.9 |
| Very poor | 37.5 or greater | 60 or greater |
Current standards for PM2.5
Air quality data collected by EPA is measured against the national air quality standards, known as the Ambient Air Quality NEPM. These standards are incorporated into the State Environment Protection Policy (Ambient Air Quality). Currently, the reporting standards for PM2.5 particles are:
| Advisory standard | Averaging time |
|---|---|
| 25 µg/m3 | 24 hours |
| 8 µg/m3 | Annual |
For one-hour PM2.5 data, EPA uses the value 40 µg/m3 as the level that triggers a ‘poor’ or ‘unhealthy for all’ air quality category. There is currently no national standard for the one-hour PM2.5 average.


Recent Comments